
Income statement
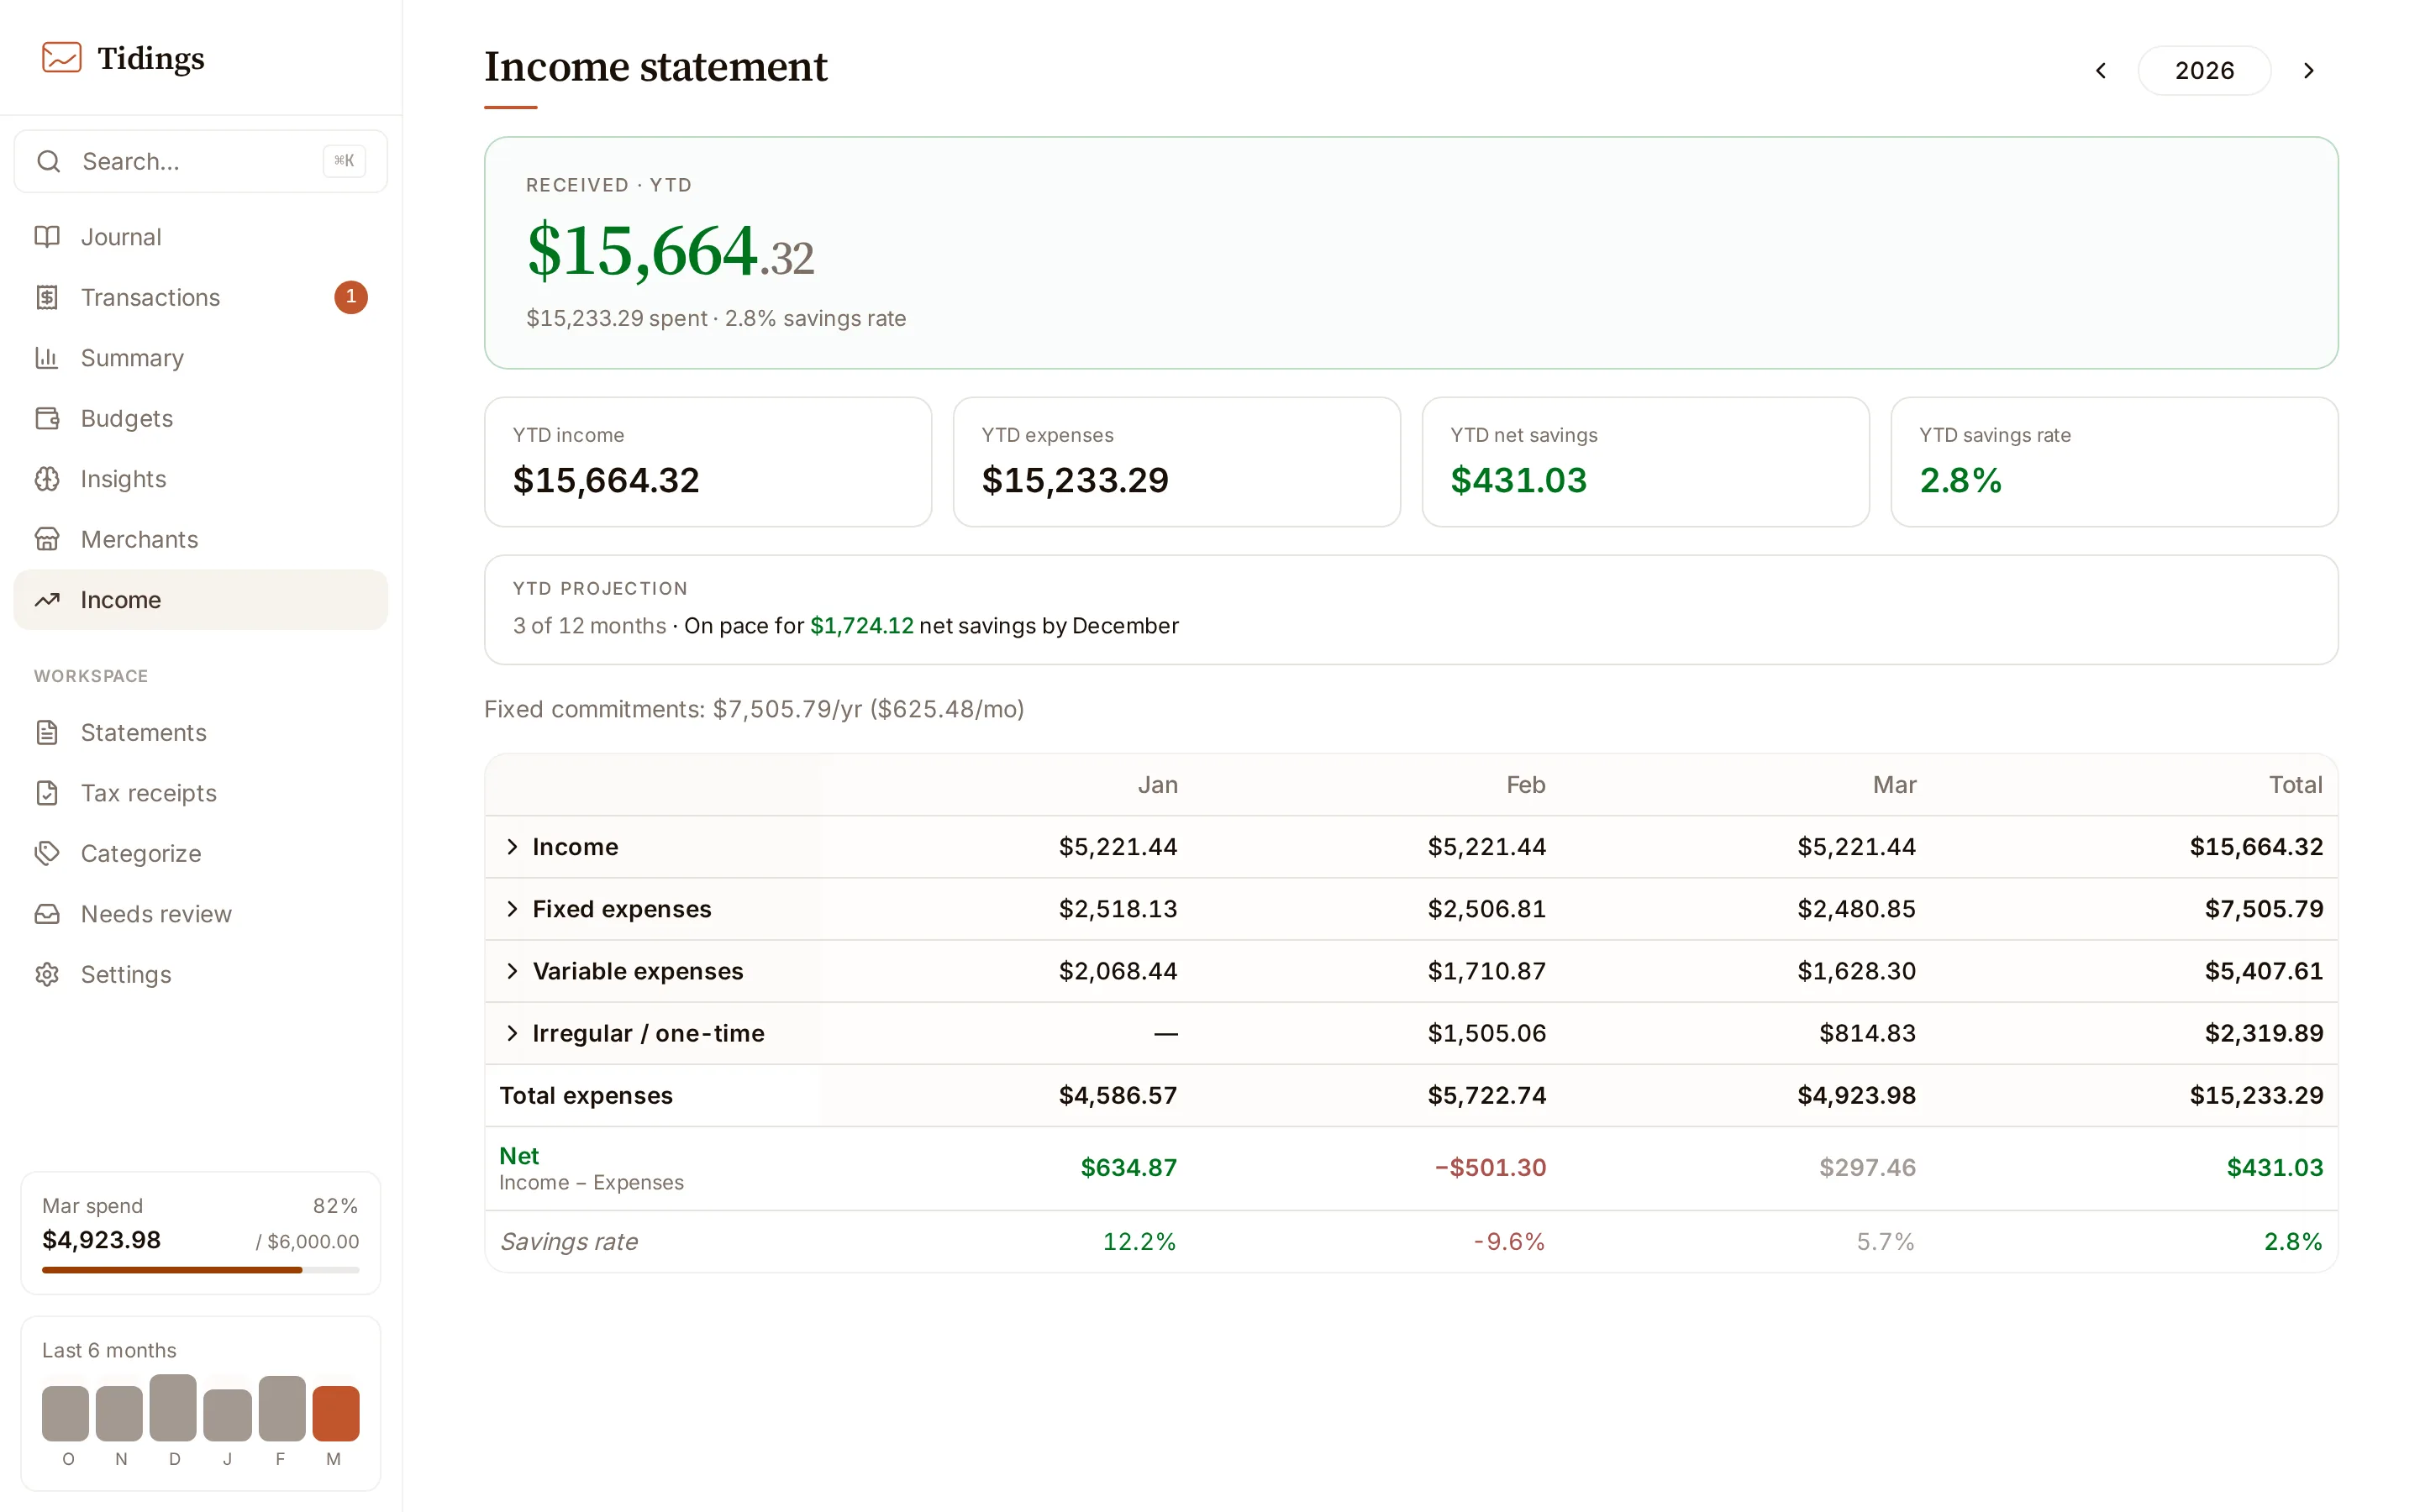
The income statement lays a year out as a spreadsheet: income across the top, expenses below, one column per month, with annual totals down the side.
What counts as income
Section titled “What counts as income”Income here is the deposit stream — the e-transfers and deposits Tidings has actually seen arrive. It is not payroll parsing: Tidings does not detect a salary or read a pay stub. If a deposit reaches your account and Tidings sees the email for it, it lands in the income section; if money arrives some other way, it does not. Read the income figures as “deposits observed”, not “everything earned”.
How expenses are grouped
Section titled “How expenses are grouped”Expenses are grouped into sections by budget category type — fixed, variable, and lumpy — the same types you set in budgets. A category with no budget defaults to variable. The fixed section’s annual total surfaces on its own as a fixed-commitments figure, the yearly and monthly weight of the expenses that do not move.
Within each category, company sub-rows break the spending down by merchant, using the same merchant aliases that shape categorization — so a merchant that appears under several raw names collects into one row.
Savings rate and the current year
Section titled “Savings rate and the current year”The savings rate is net over income — what is left after expenses, as a share of what came in.
The current year is shown in progress rather than as a finished ledger. Future months are hidden, the current month is marked as still in progress, and the annual figures are relabeled year-to-date so a partial year is never mistaken for a full one. Alongside them sits an “on pace for … by December” projection that annualizes the year-to-date figures — a straight-line read of where the year lands if the rest of it looks like the part already seen.