
Summary
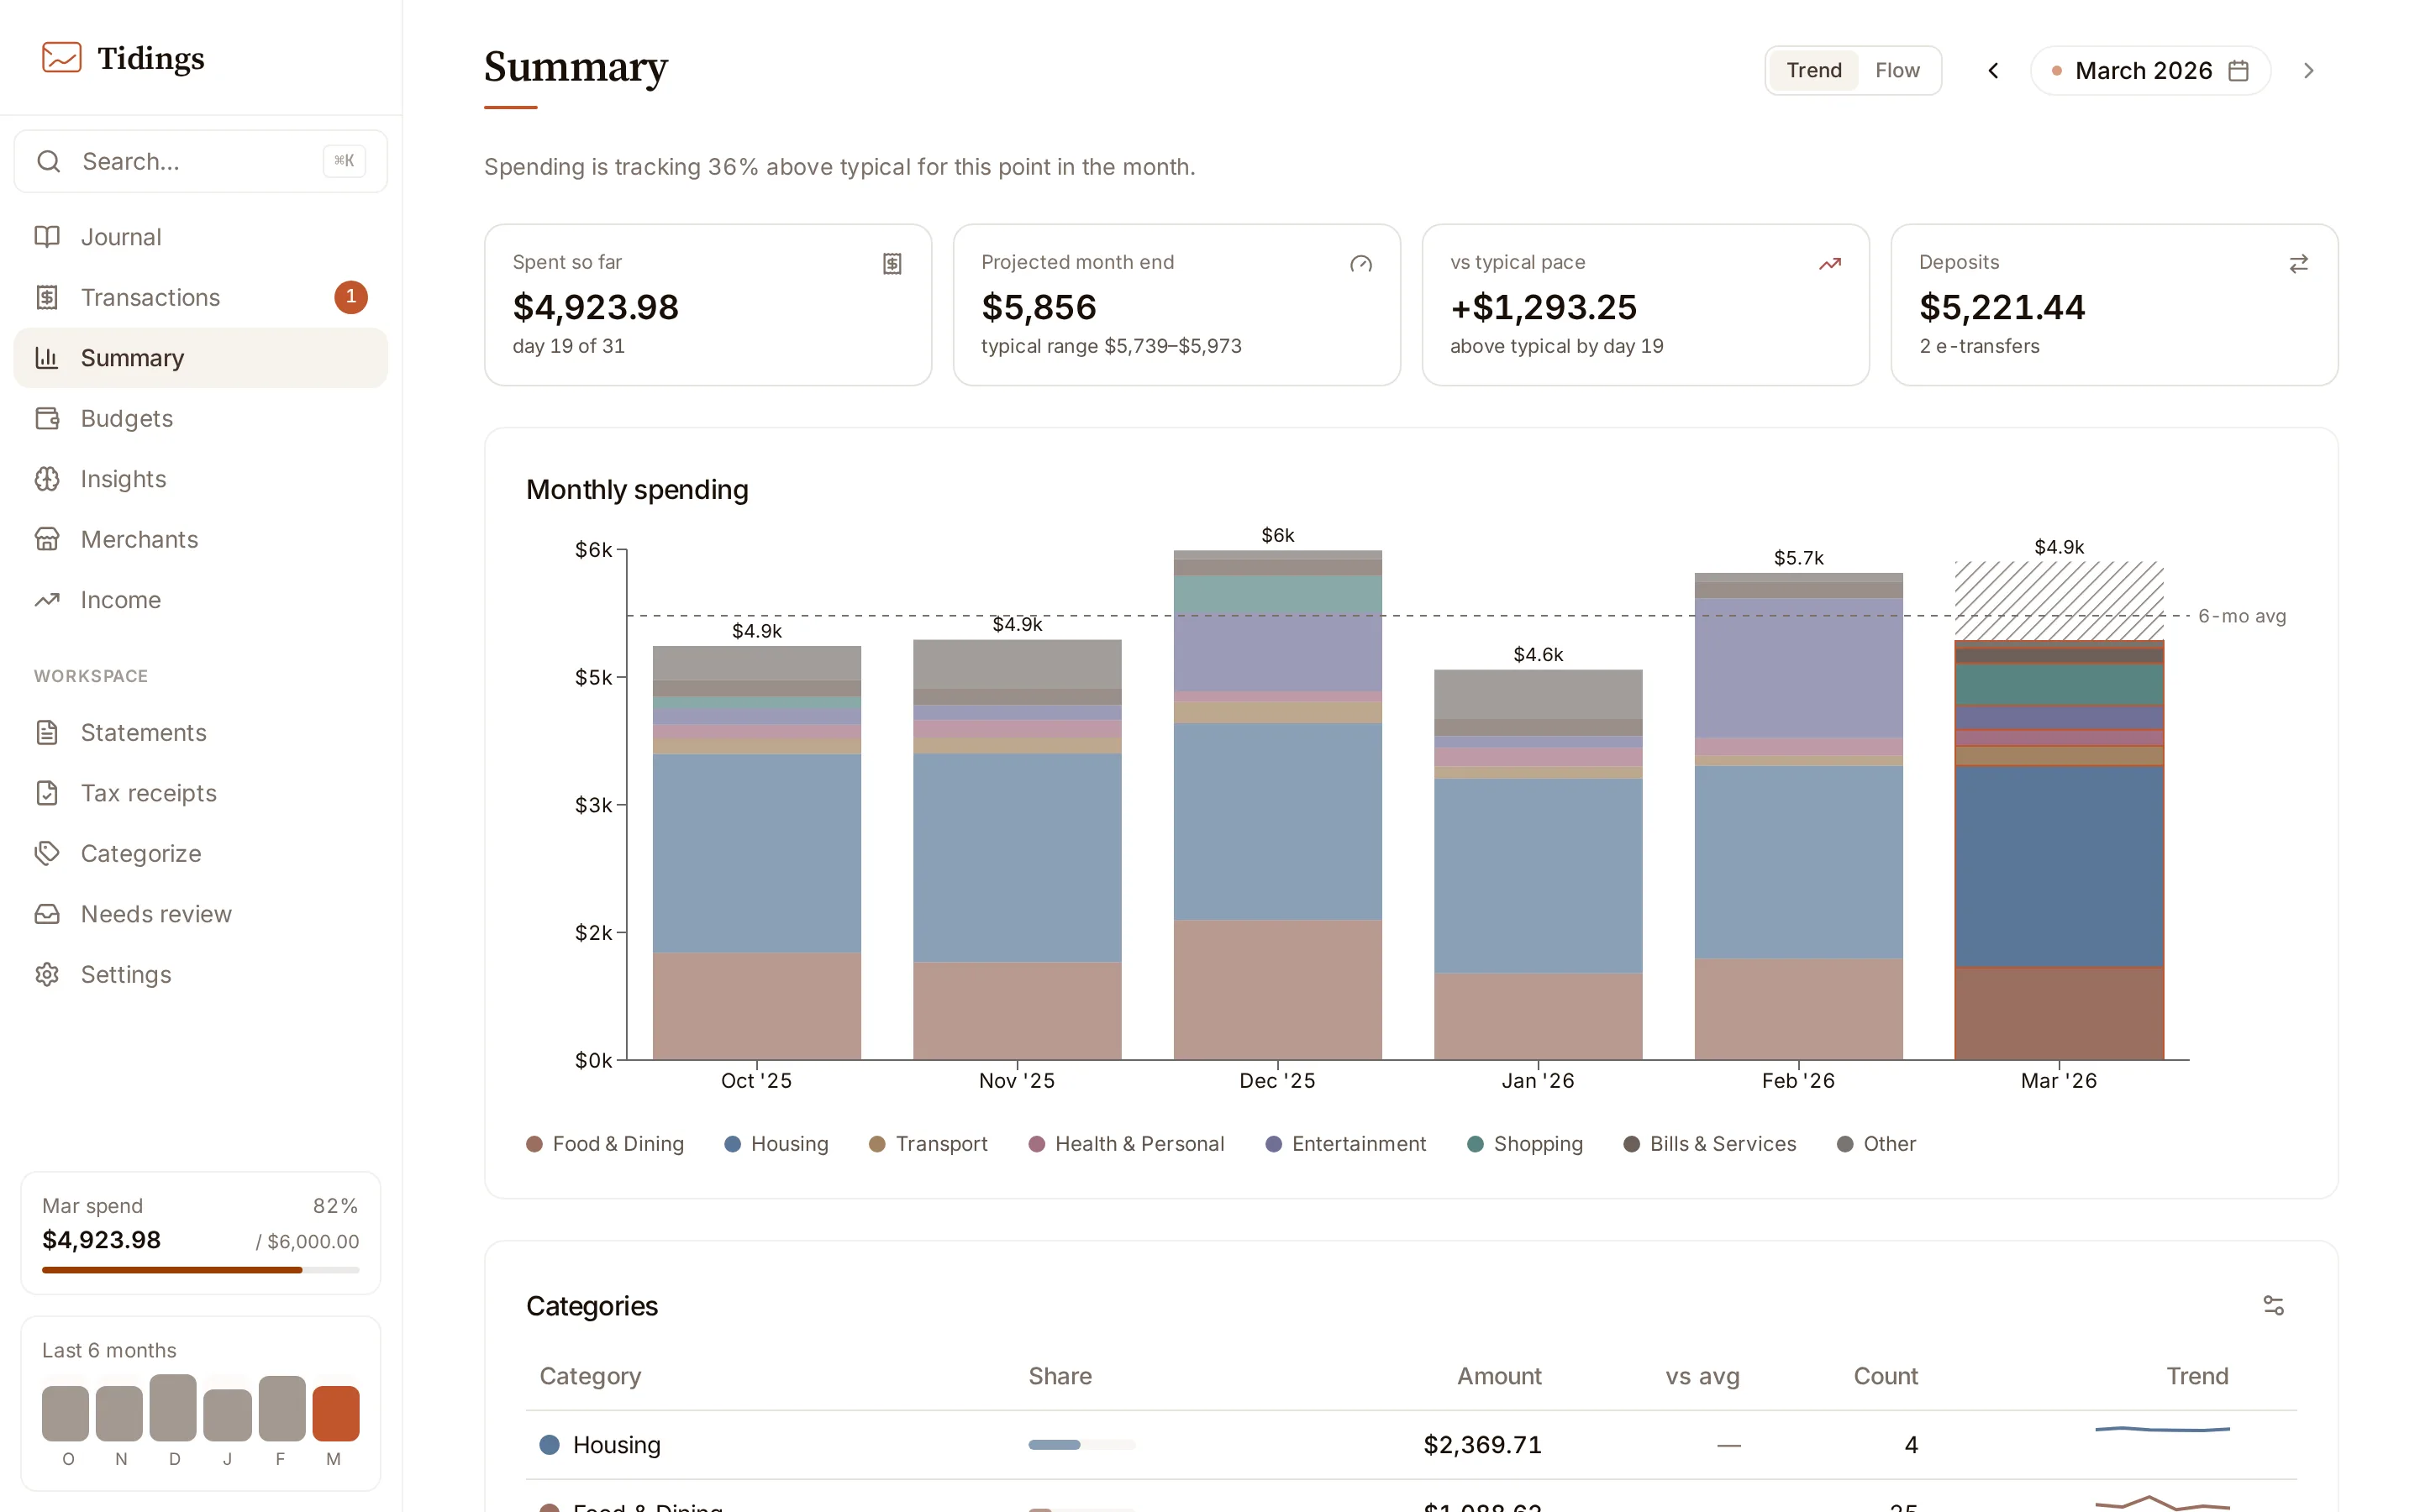
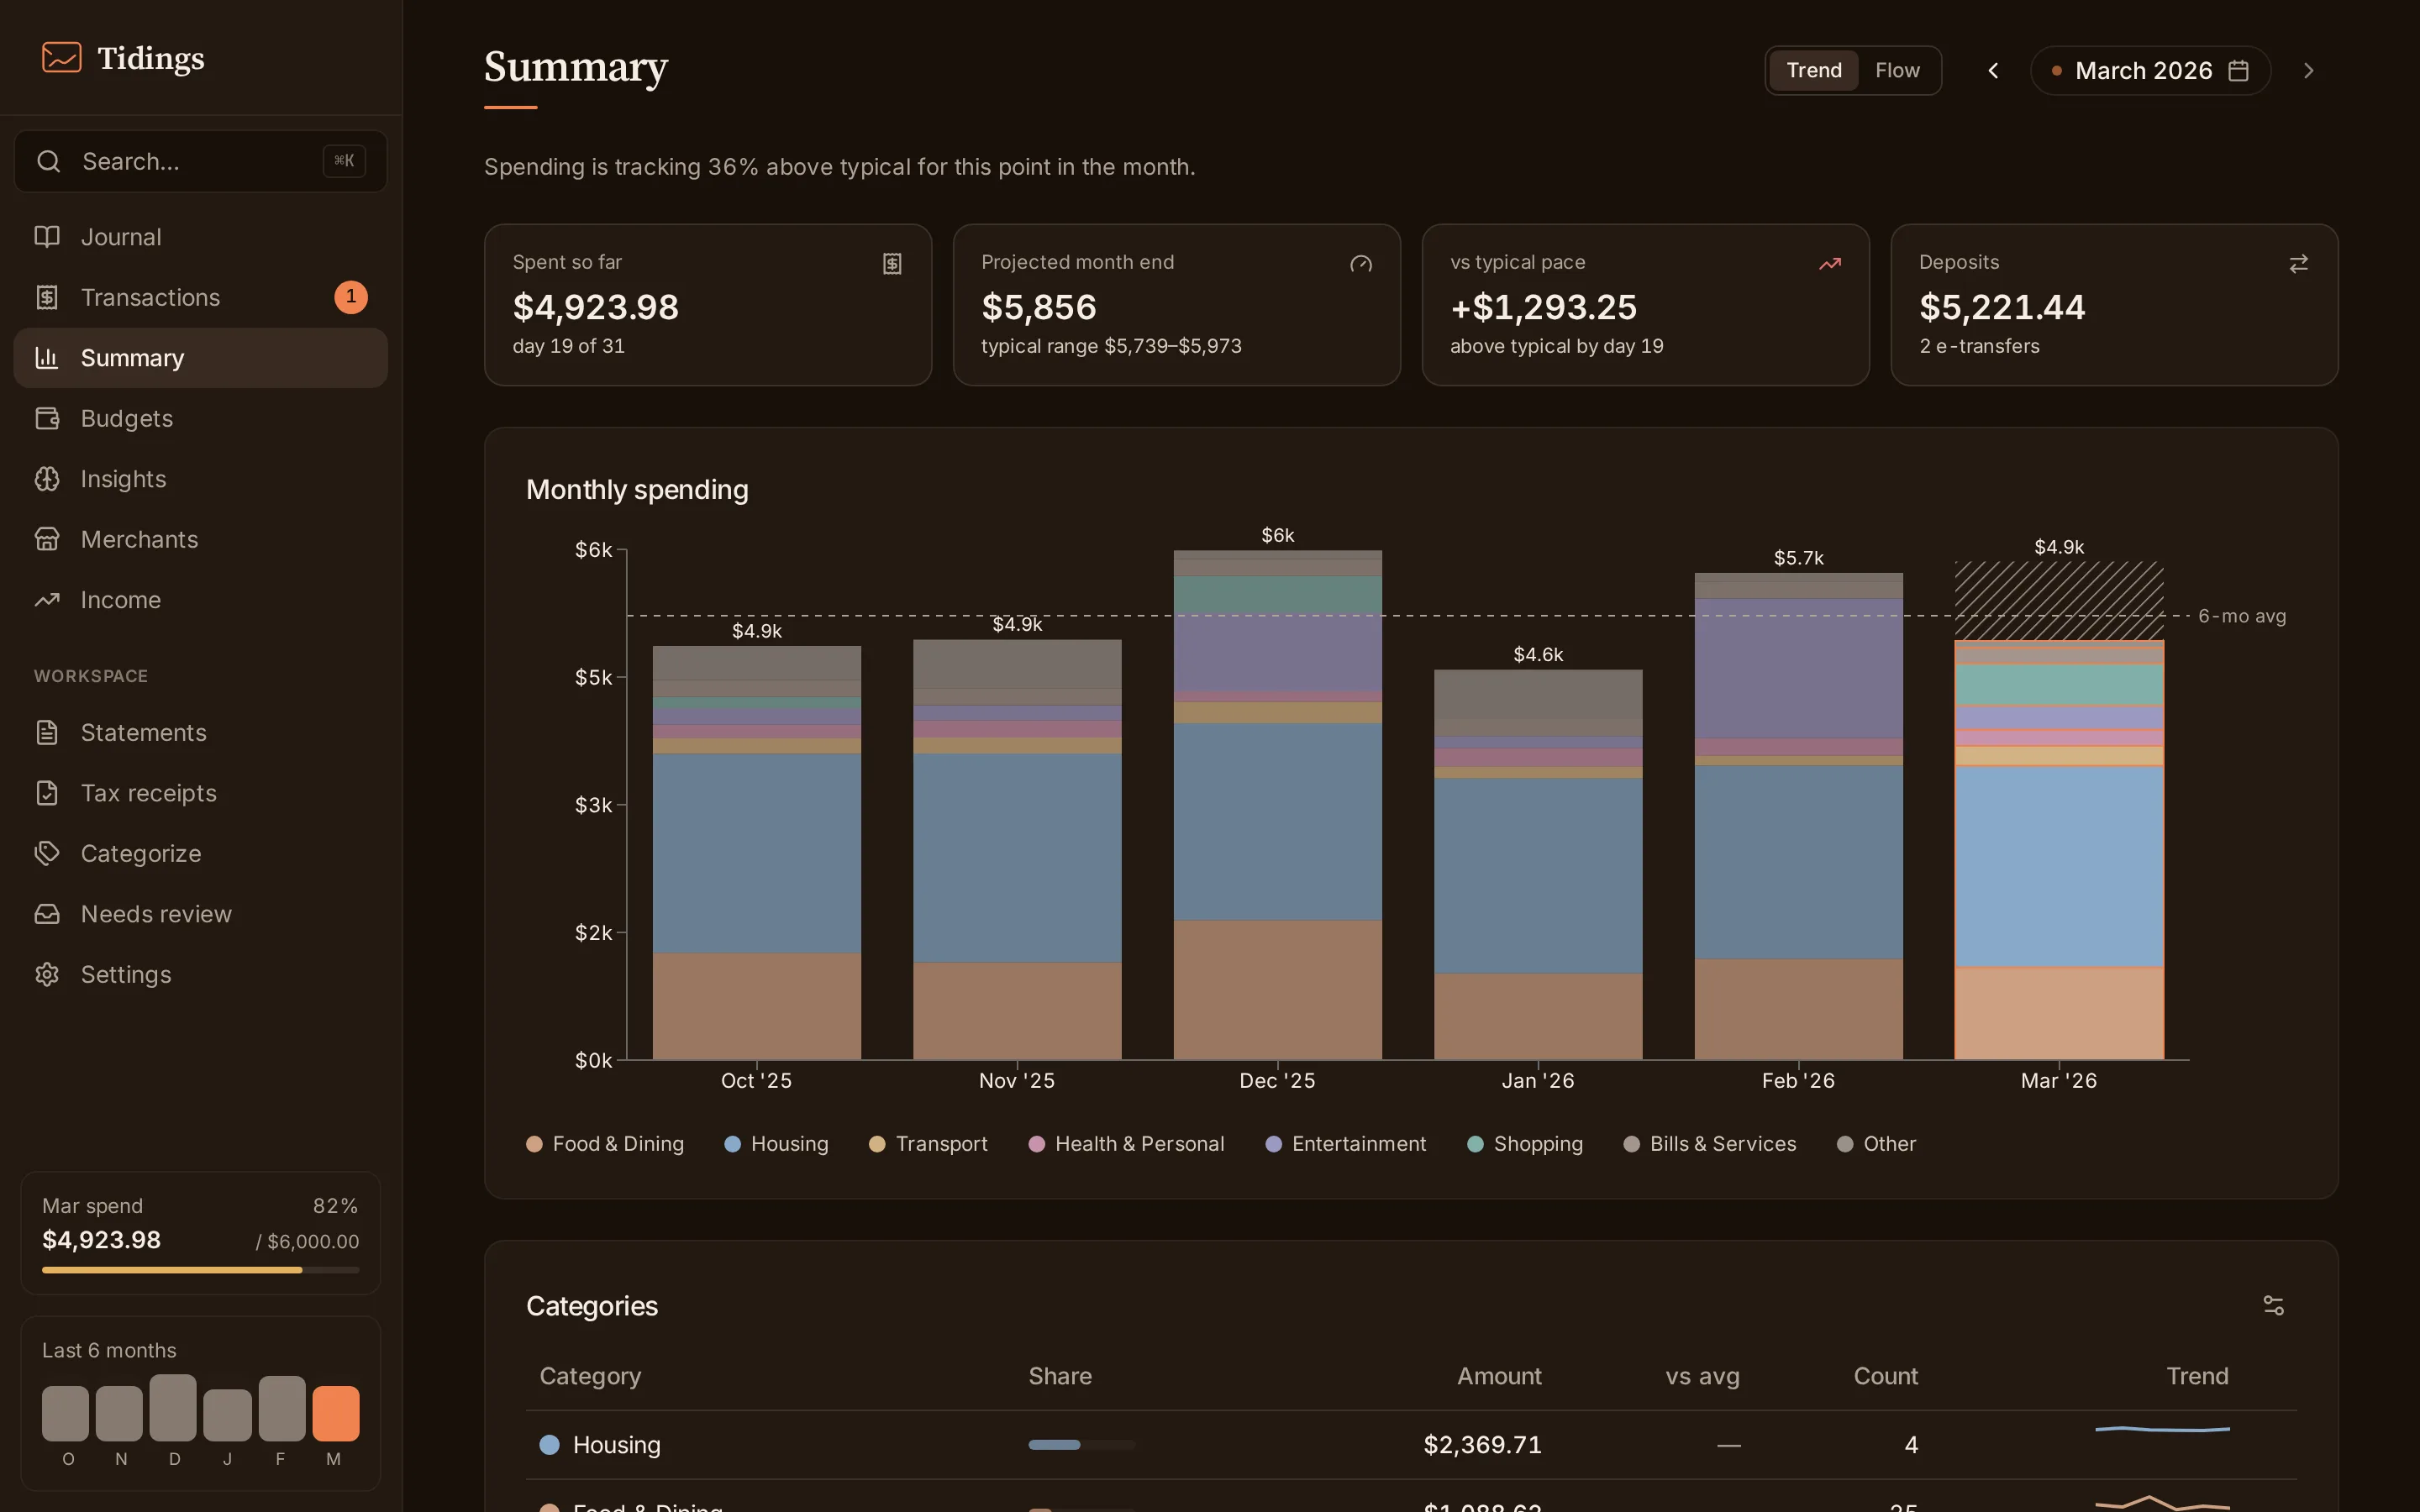
The summary is one page scoped to the month in the picker: stat cards, a visualization you can toggle between Trend and Flow, and a per-category table carrying six months of context.
The one-line headline
Section titled “The one-line headline”The sentence under the title reads the numbers for the month and states them plainly. It is deterministic, assembled from the same figures on the page, not written by the AI briefing you find in insights. It says what the month looks like; it does not judge it.
Pace, only for the current month
Section titled “Pace, only for the current month”When the month in the picker is the current calendar month, the cards describe pace — where spending stands partway through the month. You see “Spent so far”, a “Projected month end” with a typical range, and a “vs typical pace” figure that compares today’s total against what a typical month looks like by this day.
Pace needs a running month and some history to project into. Past months are already finished, so they show completed-month cards instead — the month’s total against the month before. If pace cannot be computed — too little history, for instance — the page still loads, just without the pace cards.
Trend and Flow
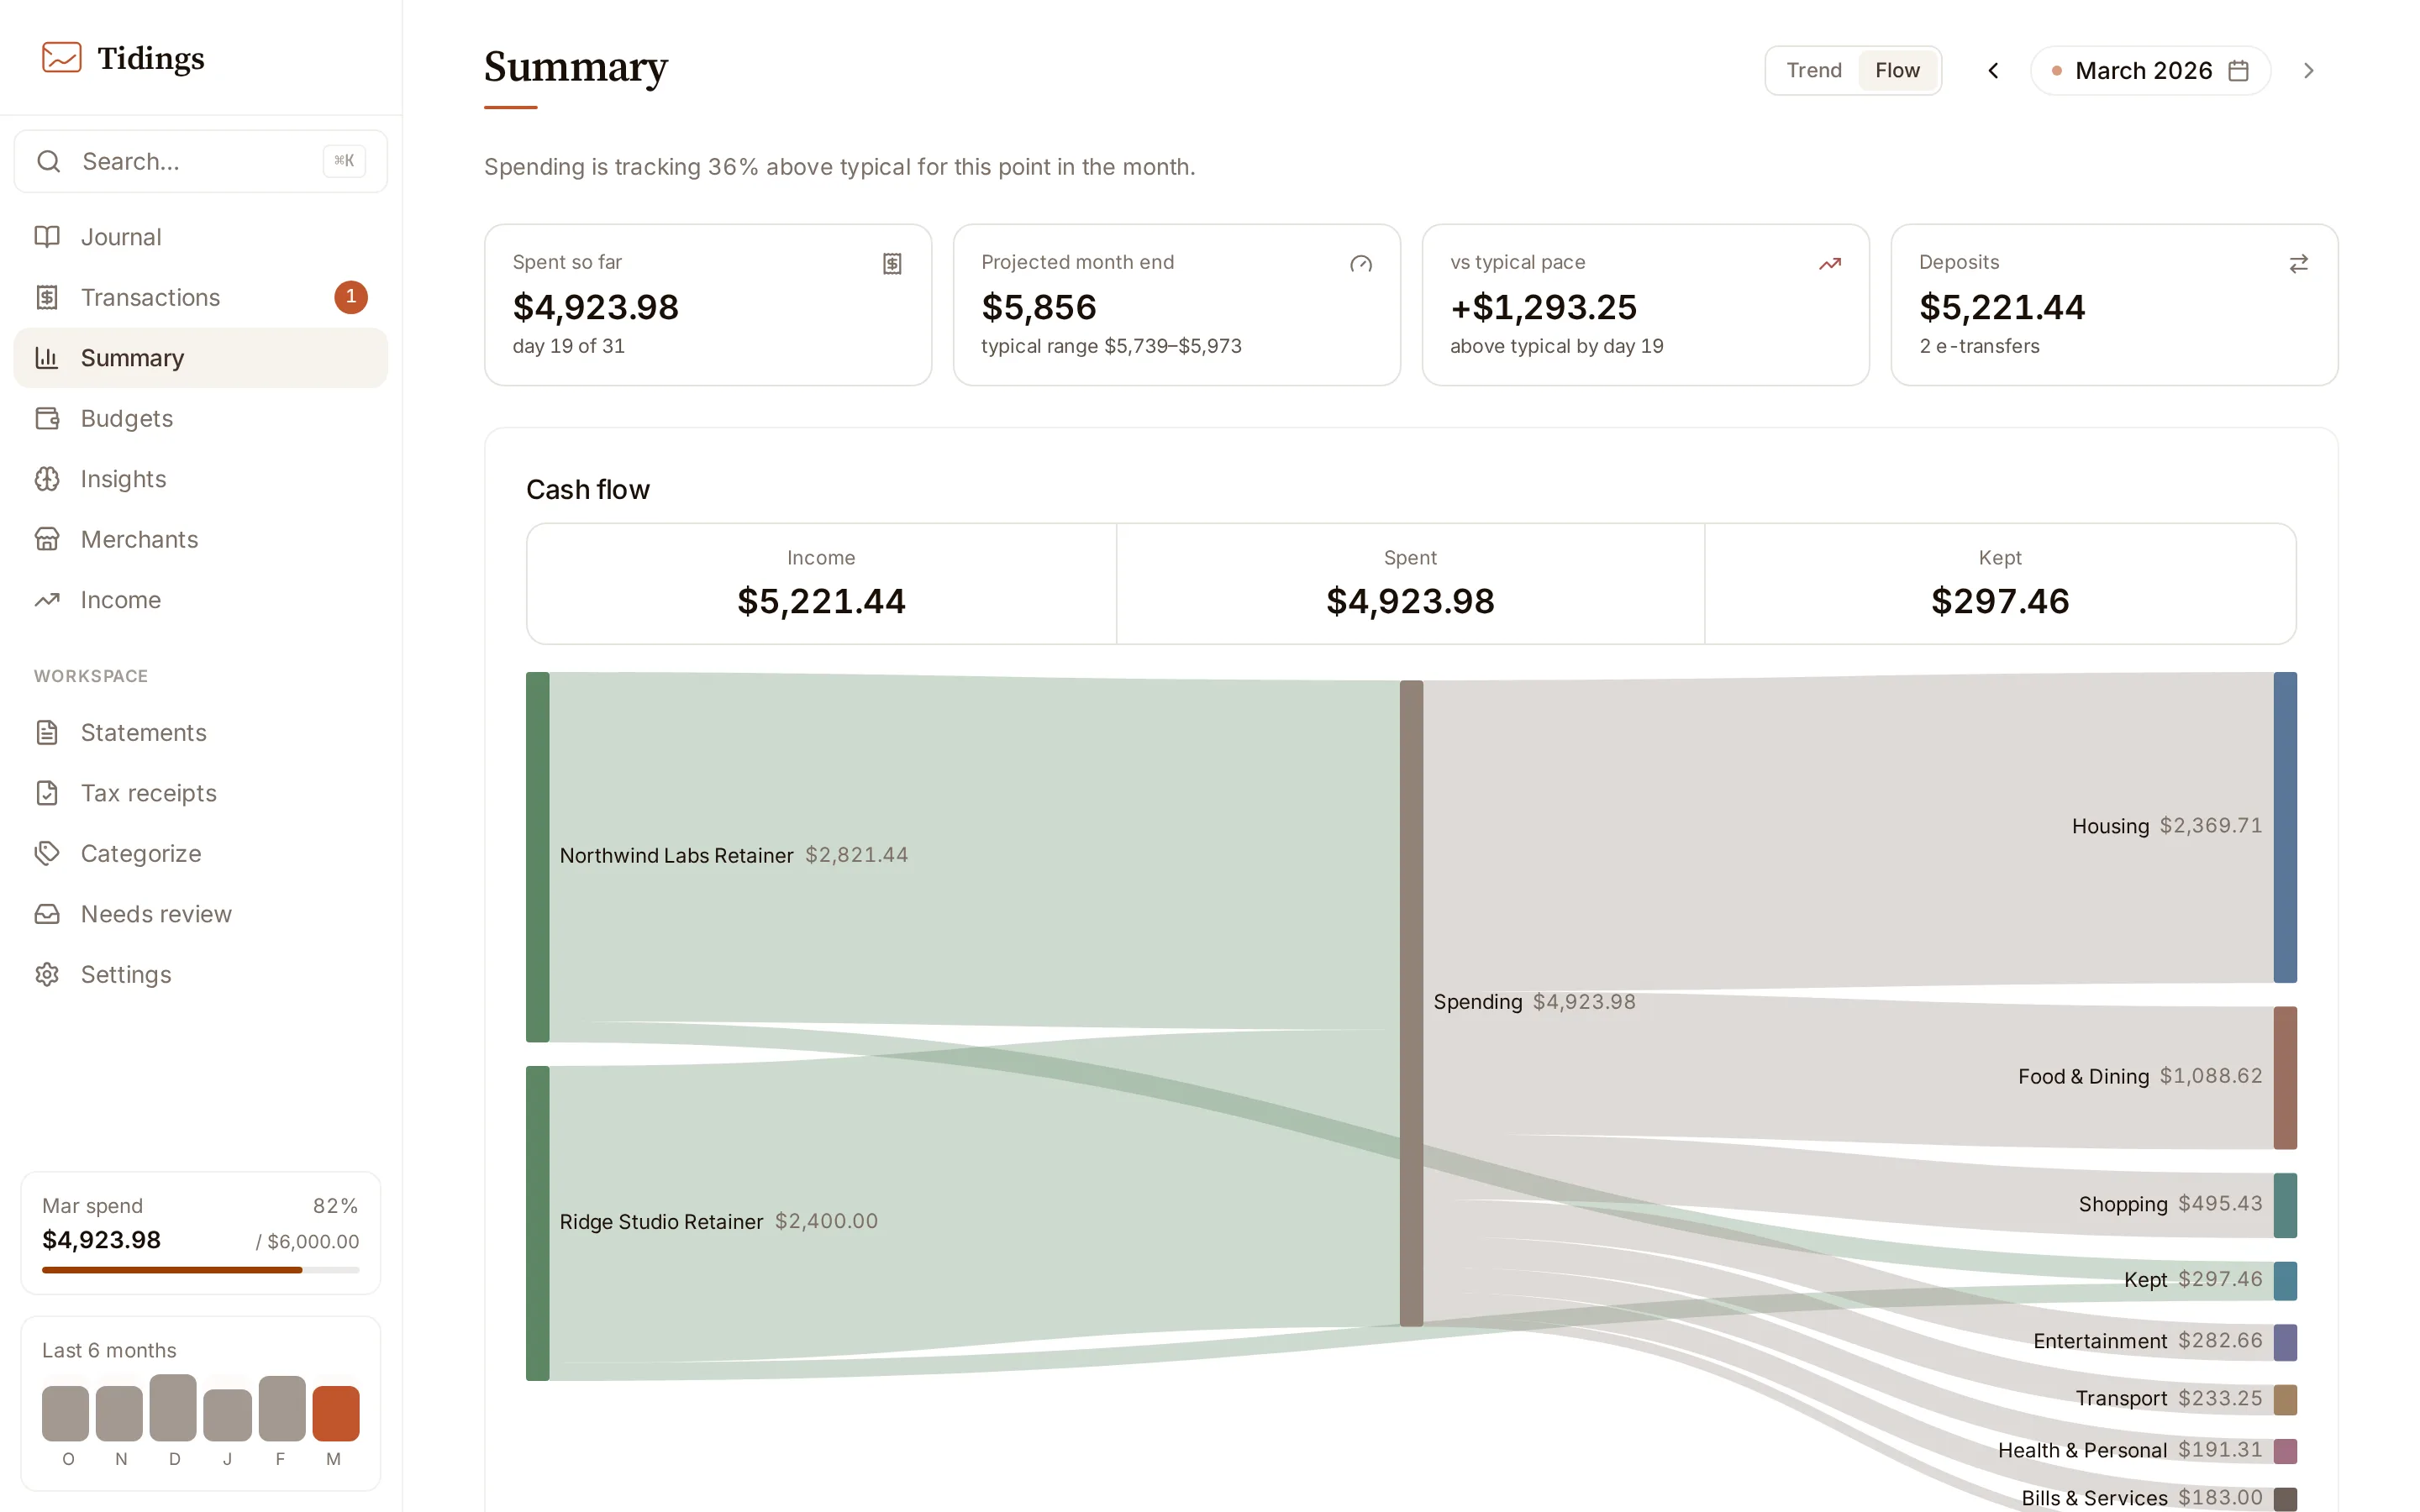
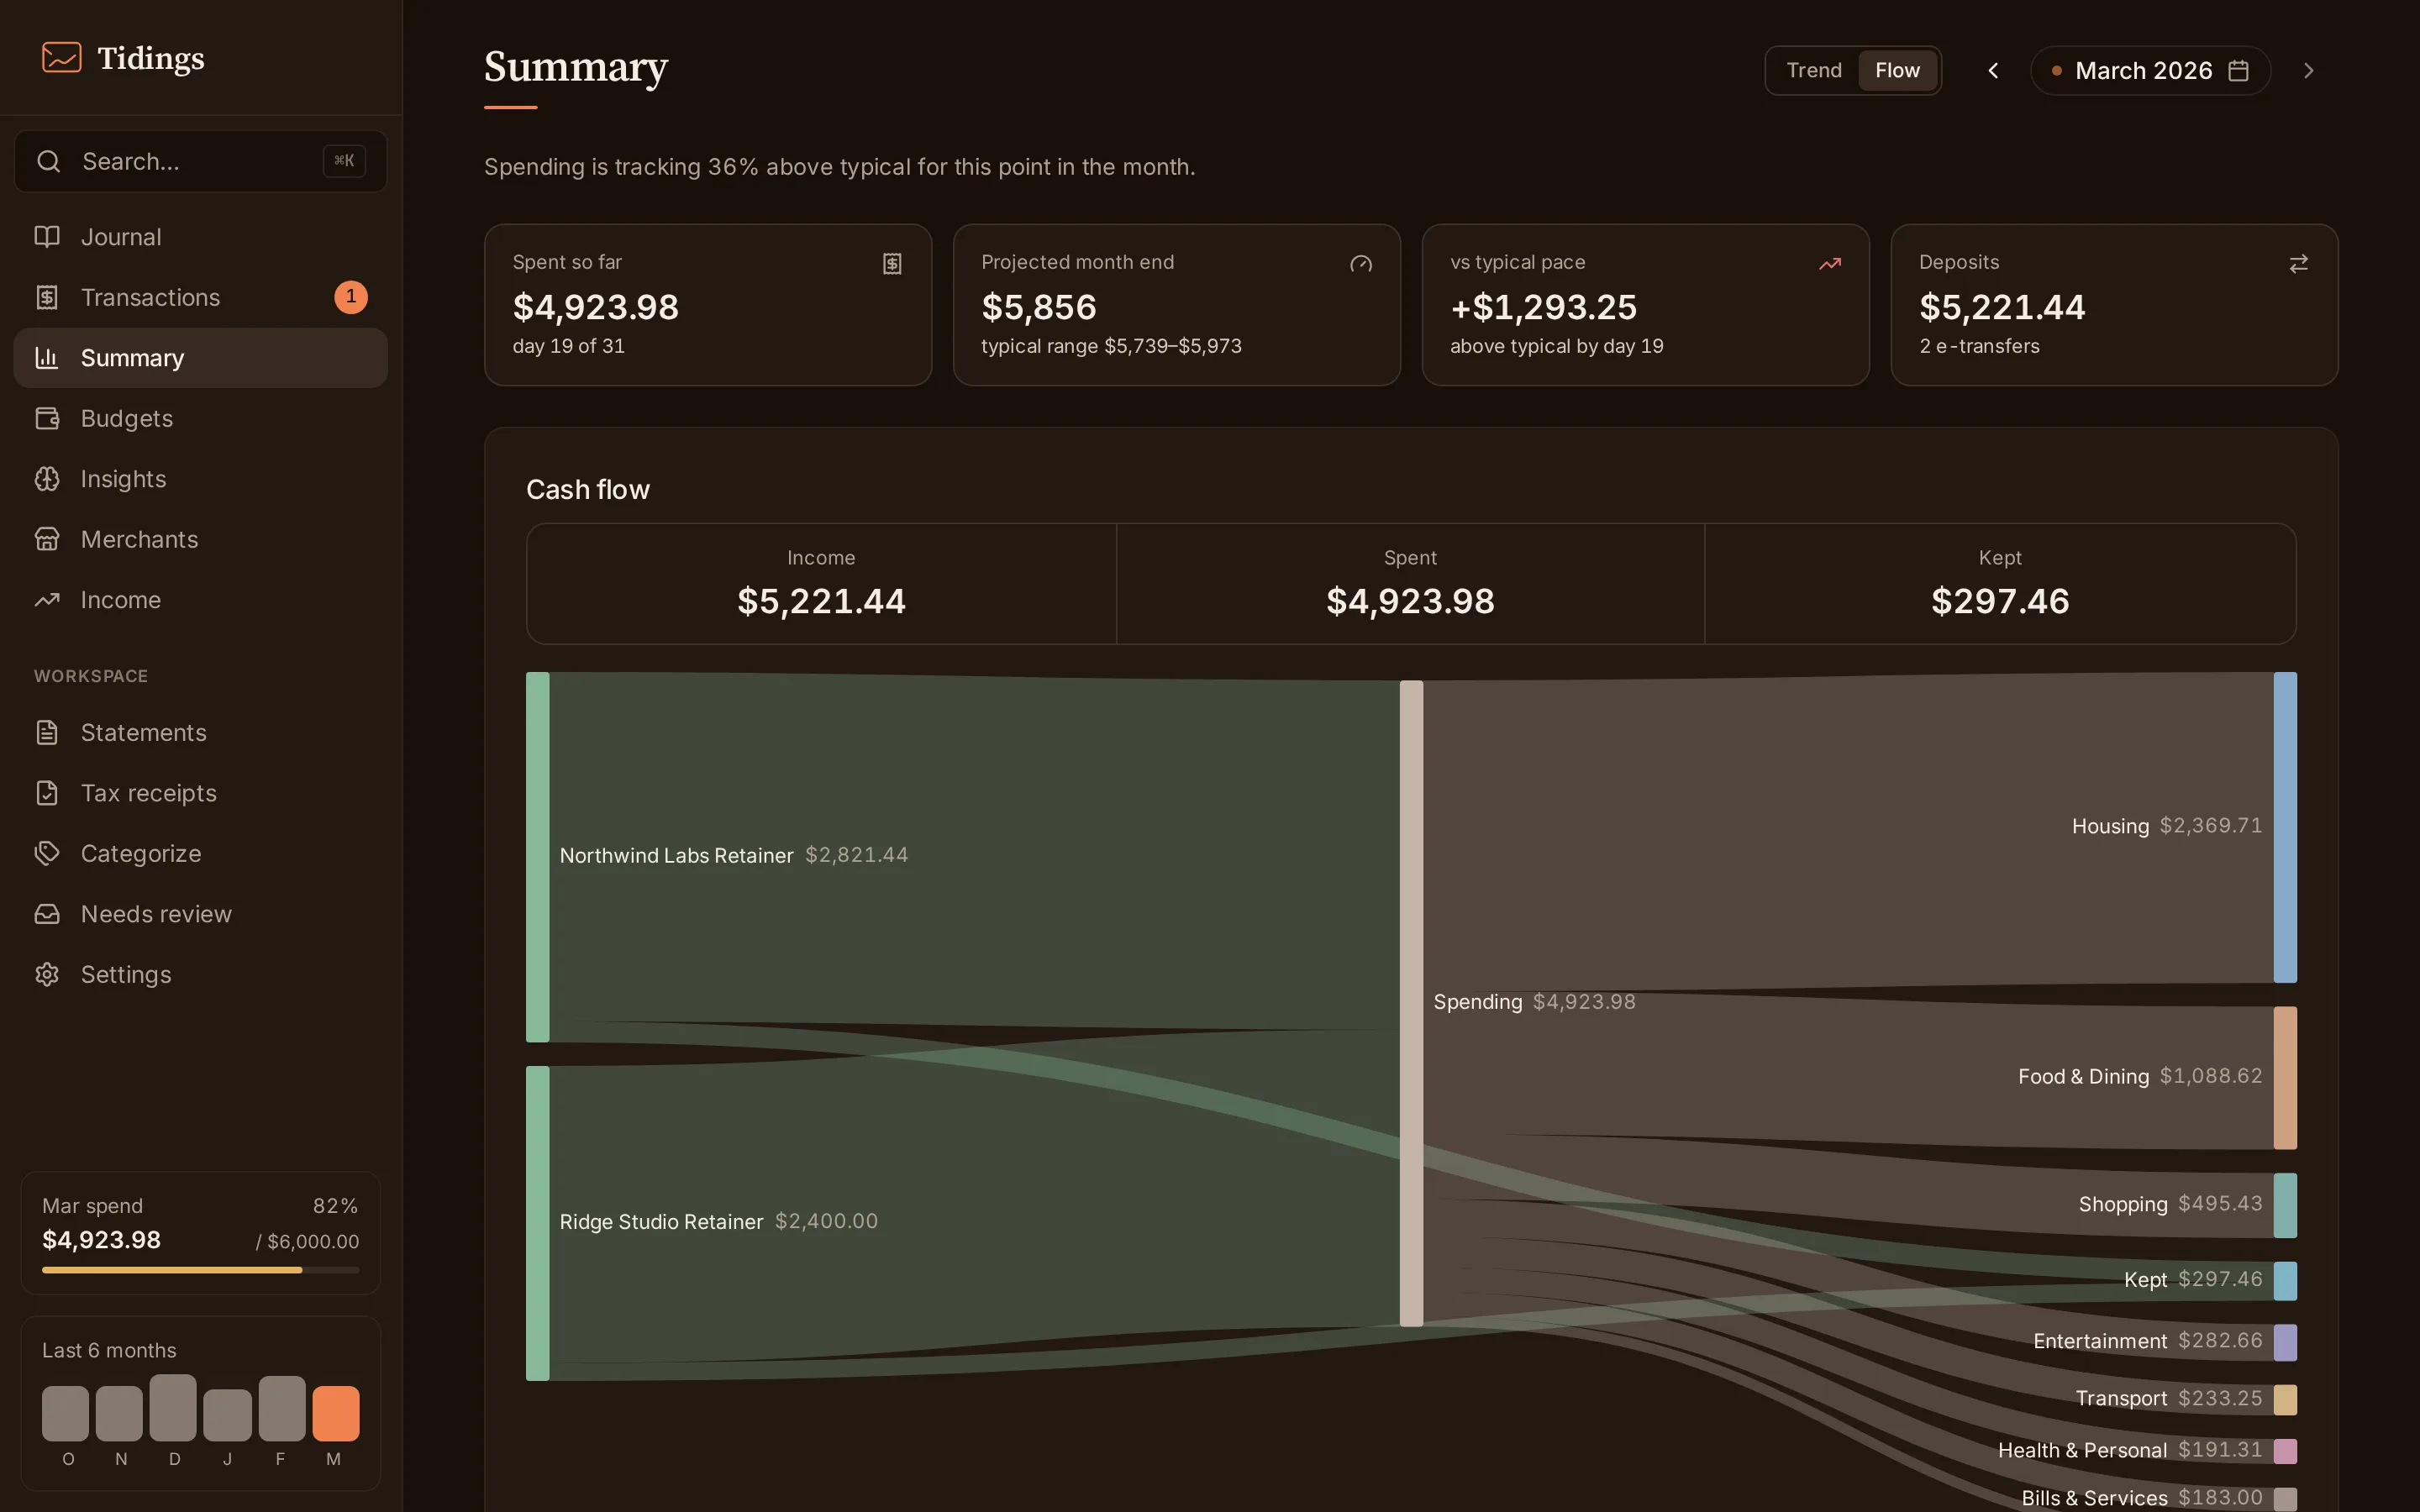
Section titled “Trend and Flow”The visualization has two views, and which one you are looking at lives in the page’s URL, so a Flow view stays Flow when you share or reload the link.
Trend charts the month in the context of recent months. Flow is a Sankey diagram of where the month went — income on one side, category groups on the other, built from the same figures as the cards, so the two never disagree. On narrow screens, below 768 pixels, the Sankey gives way to a text breakdown of the same numbers.
The category table and groups
Section titled “The category table and groups”Below the visualization, the per-category table lists the month’s spending with six months of history alongside each category, so a number reads against its own recent past rather than in isolation.
Category groups — the way categories collect into larger buckets — are editable here. Those groups are shared: the same grouping shapes the Flow diagram, the budgets dashboard, and the income statement. Edit them once and every surface that leans on them follows.
For how a transaction lands in a category in the first place, see categorization.